Granite: Another Year, Another Drop
Maybe a turnaround in 2019?
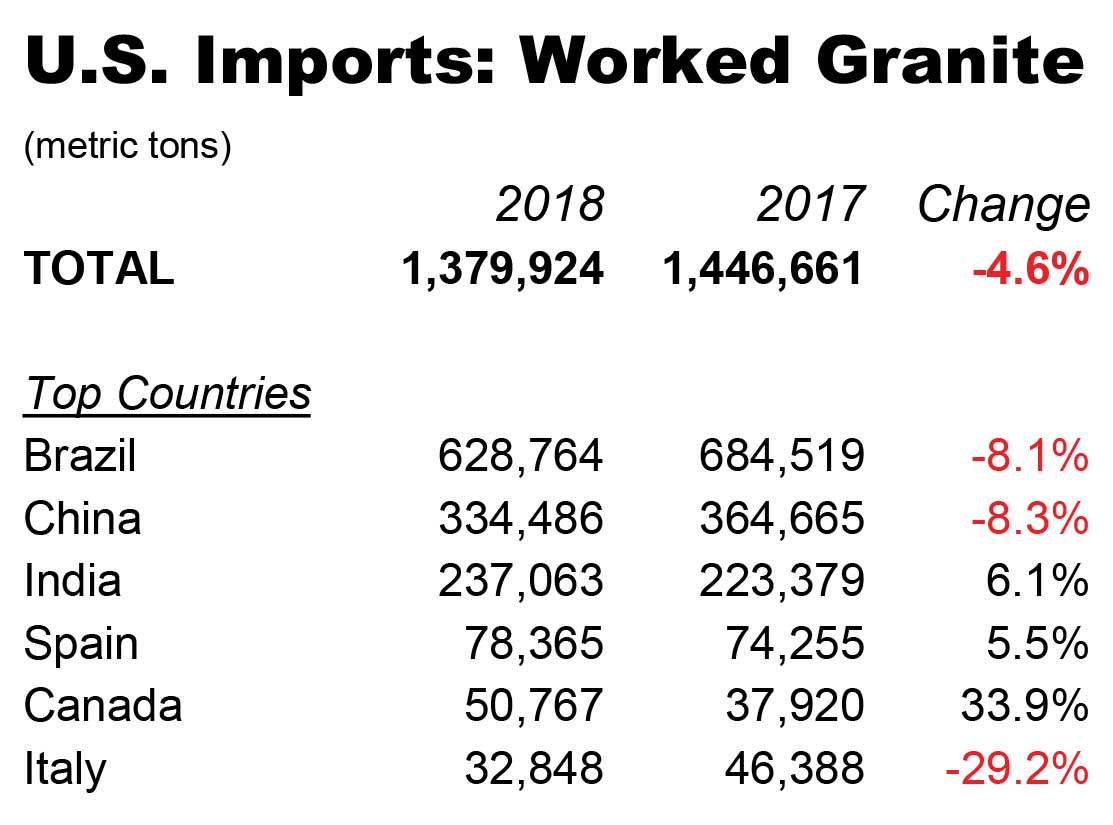
Recovering from the Great Recession took some time, but worked (sawn, one side finished) granite seemed to turn the corner in 2014 with 1.98 million metric tons in U.S. imports. It wasn’t the all-time high of nearly 2.6 million metric tons in 2006, but it sure beat the barely one million metric tons of 2009. Unfortunately, the storyline changed in the past five years. This year’s 1.37 million metric tons marks the fourth straight year of decline, and a 4.6% drop from 2017. The problem in 2018 came from the top, with two of granite’s Big Three – Brazil and China – both showing declines from 2017 of more than 8%. India, the other member of the Big Three, added 6.3% to its 2017 total.

Source: U.S International Trade Commission, Stone Update analysis
Leveling off?
Brazil’s continuing rate of decline in U.S. granite shipments is, at the very least, troublesome. The interactive chart of five-year trends (click the graph points to see volume amounts) shows a near-runaway rate of less and less granite from south of the equator.
The easy explanation is to point at Brazil’s fractious politics and uncertain economy, but those conditions don’t seem to affect Brazil’s exports of other hard surfaces; some show a five-years-running rate of improvement. The more-likely cause is a downturn in demand, with Brazil getting hit the worst of all.
Why Brazil? It’s the largest supplier to the United States at a competitive – if not lower – price than other countries sending granite here. That makes the country’s market position vulnerable if there’s another material in abundance and at comparable cost. Since 2014, that’s a position amply filled by quartz surfaces from China, which propelled that sector past granite as the largest sector of U.S. hard-surface imports.
The massive slowdown of U.S. imports of Chinese quartz surfaces at the end of 2018 (check the Quartz Surface section for more) seemed to benefit Brazil and other granite suppliers, with an increase in shipments in early 2019. The long decline for granite may be showing signs of leveling off.
Interacitive chart.
Source: U.S International Trade Commission, Stone Update analysis
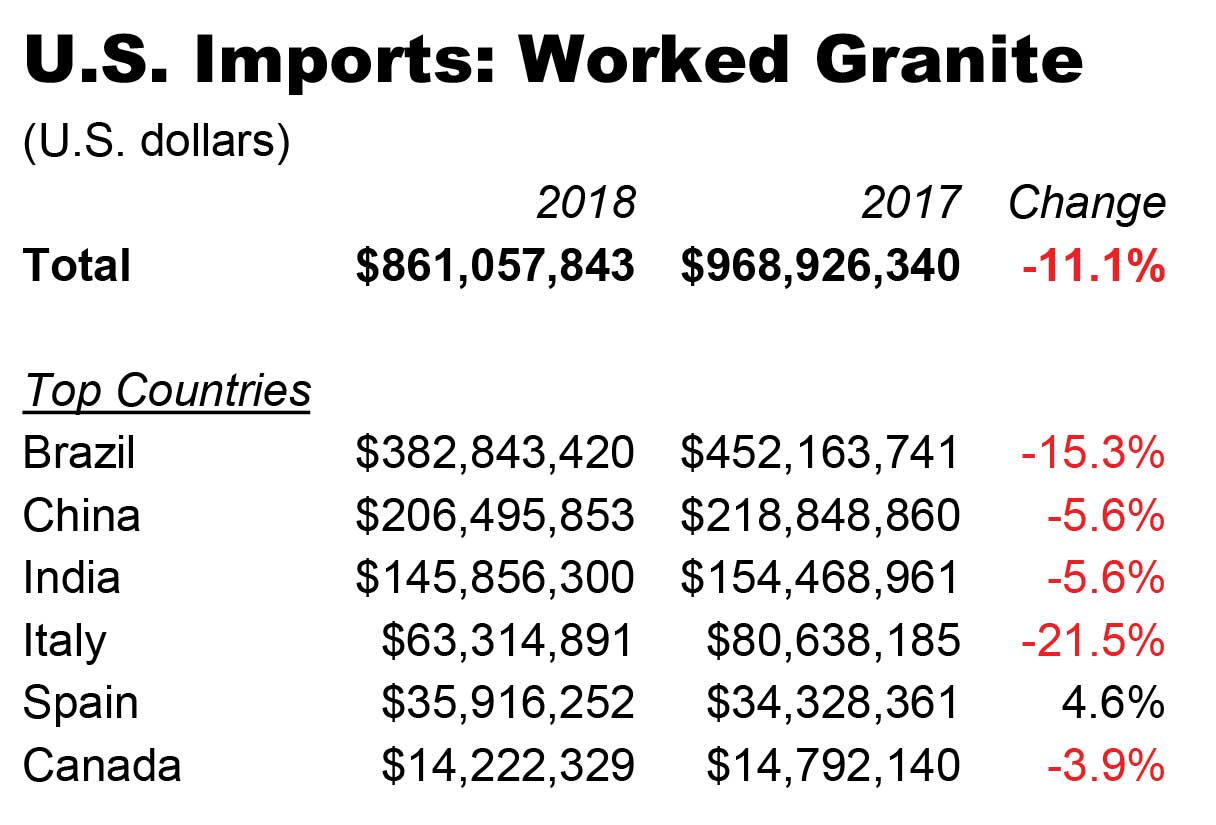
Reduced demand is bad enough, but granite imports continue to suffer from another problem: diminishing returns. When the year-to-year change of declared customs value drops faster than the decline of tonnage received at U.S. ports-of-entry, exporting countries are not only shipping less – they’re getting less revenue.
Brazil took the biggest hit financially as the largest granite shipper to the United States in 2018, with a 15.3% drop in values resulting in a -7.2 Misery Rating (the difference between tonnage and customs value). India, meanwhile, showed a higher percentage of bottom-line pain; while volume grew 6.1% from 2017, values fell by 5.6% for a Misery Rating of -11.7.

Source: U.S International Trade Commission, Stone Update analysis
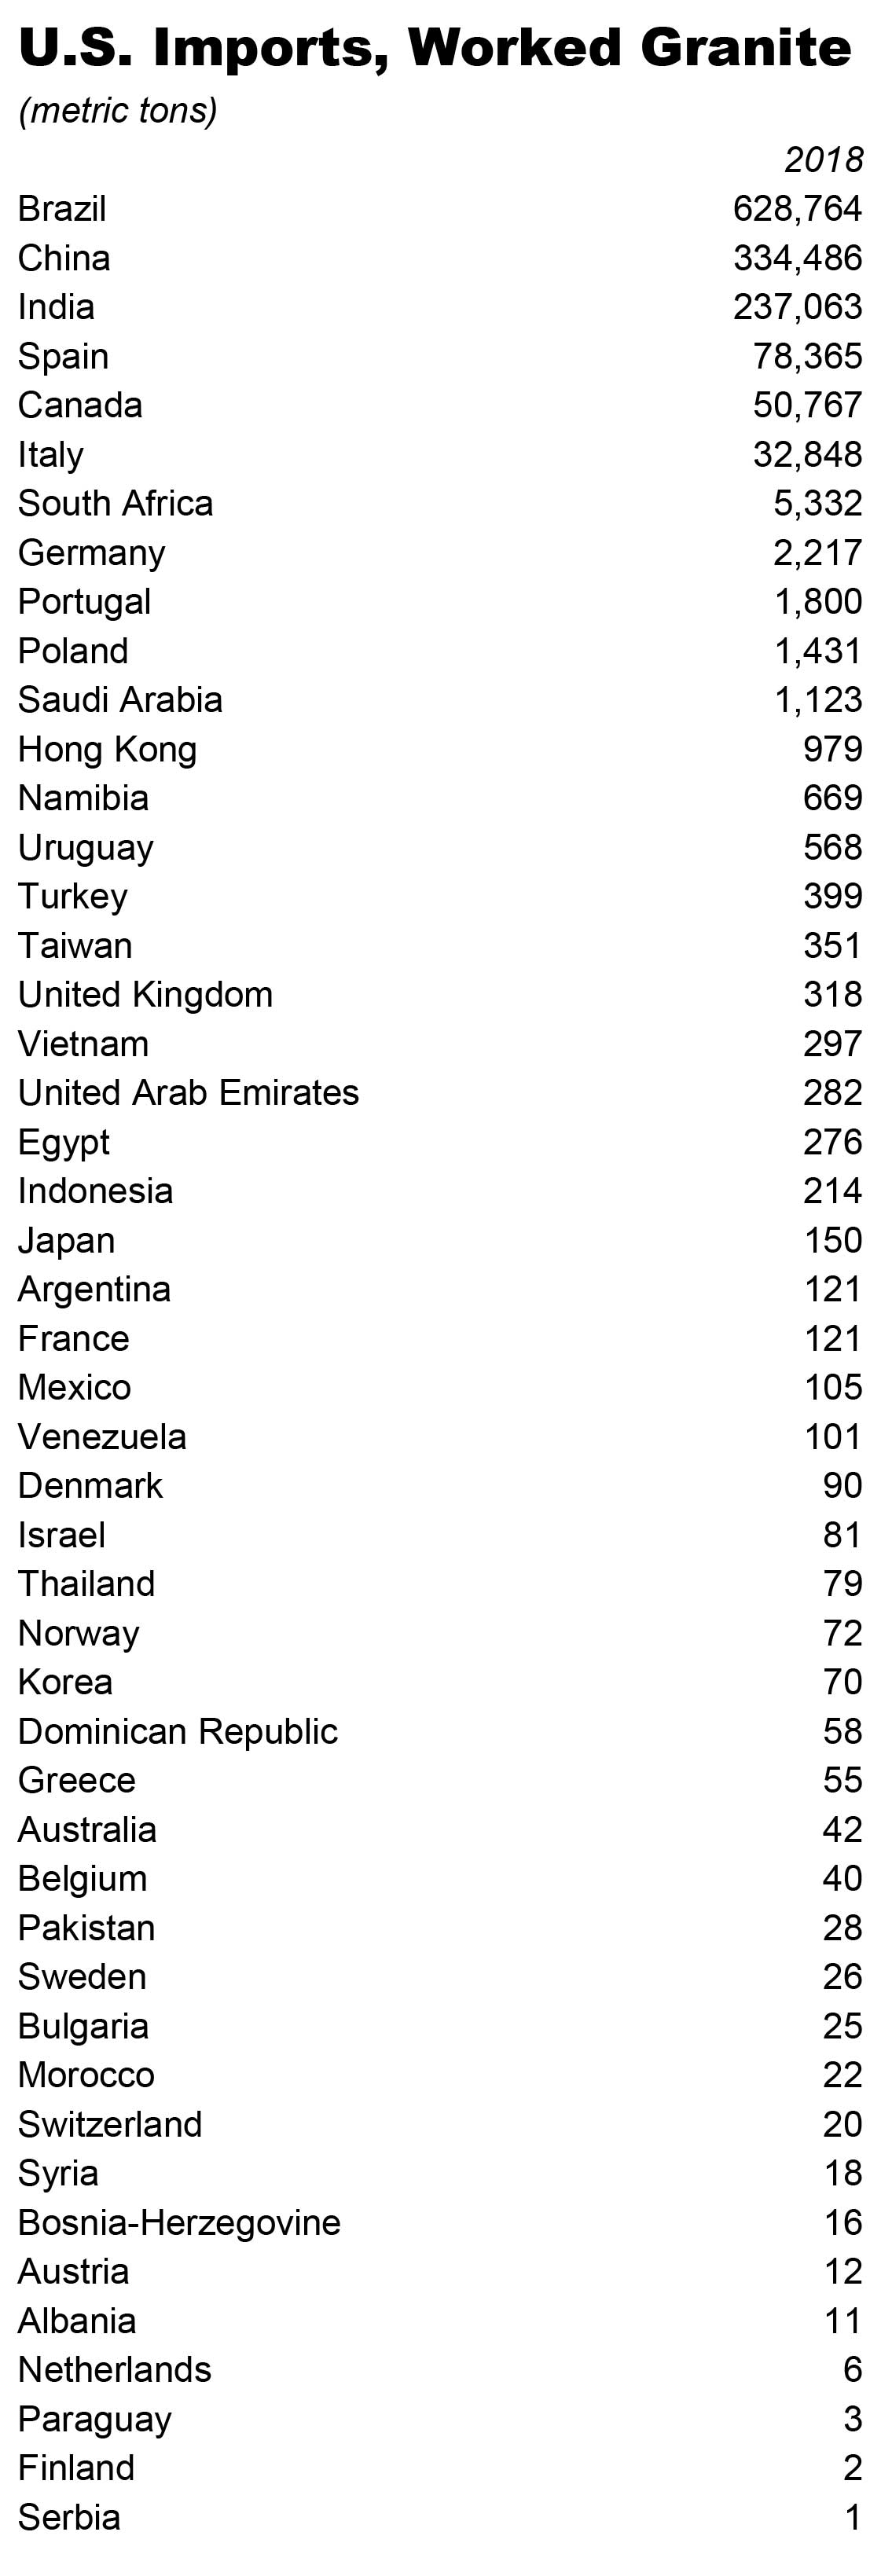
All Countries, 2018

Source: U.S International Trade Commission, Stone Update analysis

Source: U.S International Trade Commission, Stone Update analysis