Quartz Surfaces: Busted by the Feds
China's rocket ride shot down.
The $35-million gap between granite and quartz-surface values should close completely in 2018 … barring any extraordinary action.
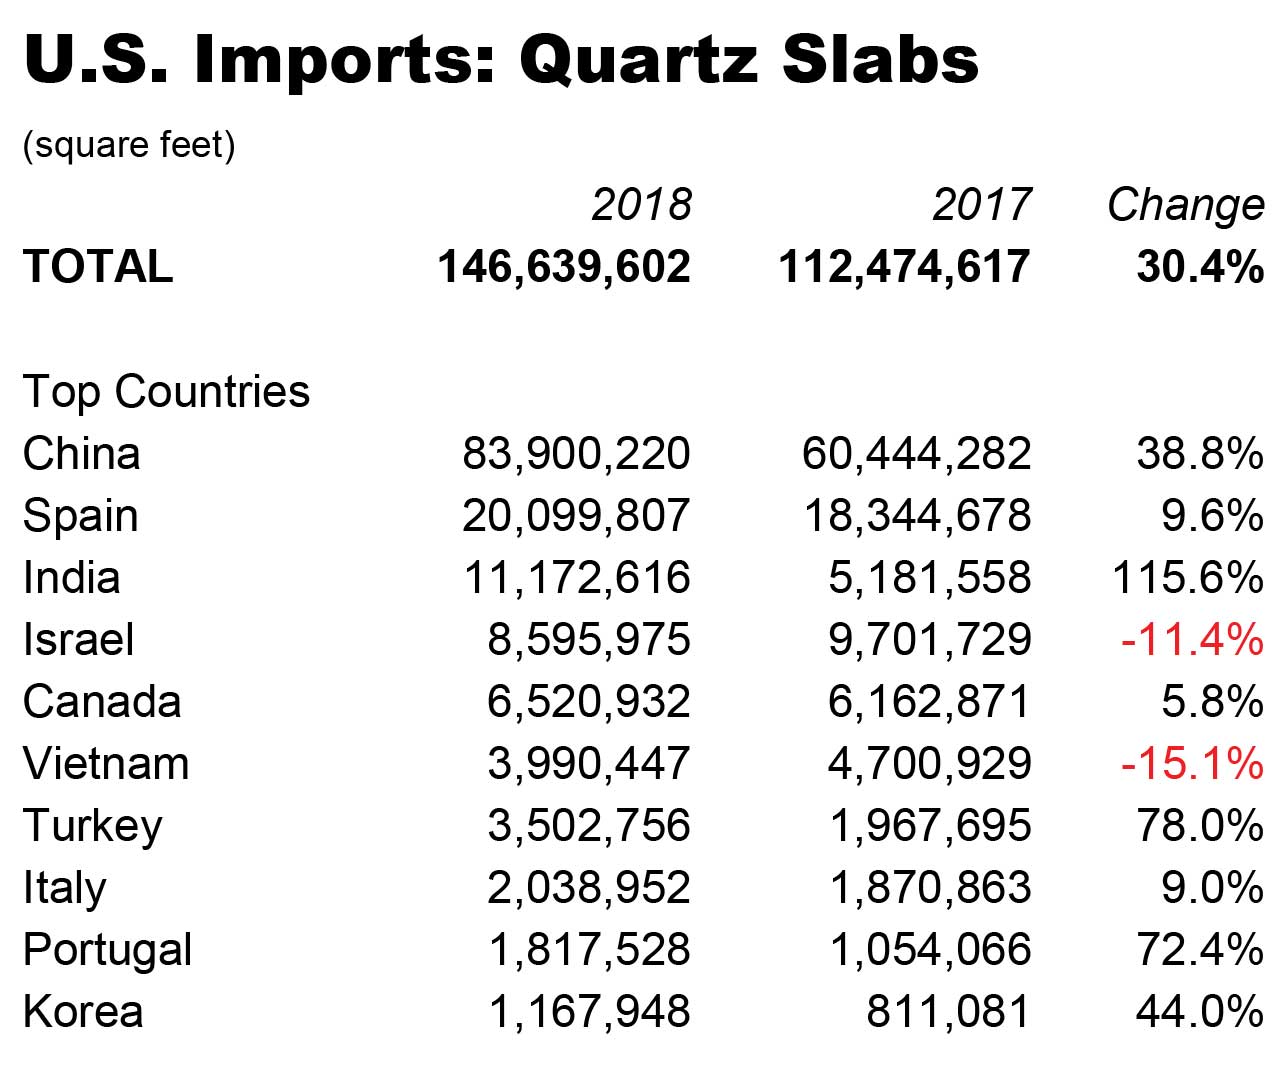
Stone Update’s U.S. Hard Surface Imports 2017 As for that prediction: The value gap with granite closed completely and then some, as U.S. quartz-surface imports passed the $1 billion level in 2018. And, yes, there’s also been some extraordinary action … that will likely bar the sector from reaching as high again for years. The effort of Cambria Company LLC to seek U.S. government action against Chinese exporters on unfair-trade grounds – and the massive push of quartz-surface slabs from that country to beat possible tariffs – is a story that Stone Update closely followed last year. The final decision should come by early June, but the specter of massive duties on China-made quartz twisted the sector in ways that will continue through 2019.

Source: U.S International Trade Commission, Stone Update analysis
A flood, then a trickle
The regulatory battle about Chinese quartz-surface tariffs involves 00tens of thousands of pages of legal filings and hours in Washington hearing rooms. Surface manufacturers and importers didn’t wait for the final decision, however. The result was a wild show that probably won’t be seen again in the hard-surfaces market.
Ironically, when Cambria filed its petition with the U.S. International Trade Commission last April, Chinese quartz-surface imports had just gone through a three-month slump. This kind of early-year downturn is an annual occurrence that reflects the timing of the Chinese New Year, with a sharp upturn as post-holiday shipments finally reach U.S. ports in May.
The upturn kept going through the summer on a path to rival a Saturn V moonshot. Chinese shipments to the United States peaked in August with more than 12.9 million ft². (Check the accompanying interactive chart for exact figures.)
And then the rocket ride went into reverse, with China’s shipments plummeting monthly, down to 896,697 ft² in December. The fall continued through early 2019, with China’s quartz-surface exports crashing to 144,408 ft² in February.
What happened? Cambria had filed with the U.S. government for a declaration of extraordinary circumstances, based on early summer’s indications of a mass movement of Chinese product to the United States to circumvent possible new tariffs. Cambria’s request would make tariffs effective on exports received up to 90 days prior to the federal Department of Commerce’s decision to tentatively approve new tariffs.
In November, U.S. trade regulators granted Cambria’s request for essentially backdating the tariffs, which could average more than 300% of customs value for Chinese quartz surfaces. Shipments received in the United States after mid-August would be affected.
The shaded area of the 2018 month-by-month shows, roughly, the time period of what’s being called retroactive tariffs. The start of those new tariffs coincides with the massive drop in Chinese quartz-surface shipments.
Here’s the remarkable part: Cambria filing for extraordinary circumstances came in early October. Chinese manufacturers and exporters, however, were already dramatically scaling back shipment departures in August, eerily anticipating the effective date of tariffs.
The tariff controversy, meanwhile, overshadowed a successful year by most of the other quartz-surface-exporting countries, including India’s bold 115.6% increase from 2017 and Turkey’s big (78%) step up in 2018.
Interactive Chart
Source: U.S International Trade Commission, Stone Update analysis
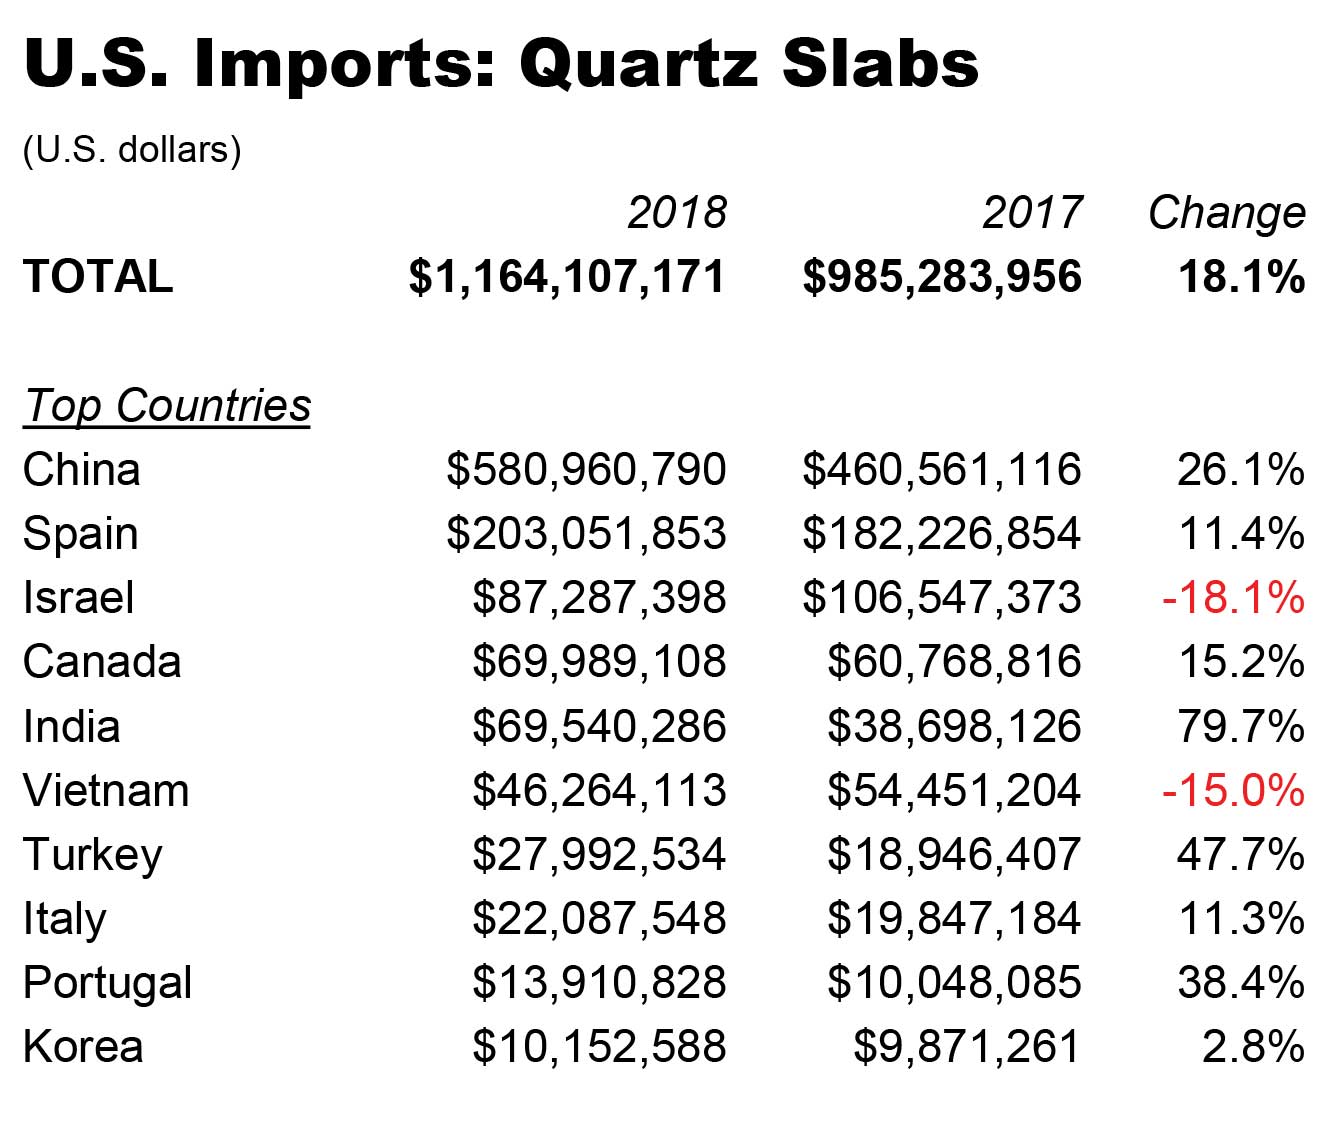
It’s no surprise that China also lead in quartz-surface-import value, although the difference between volume (60.1%)and value (53.8%) growth offers the clue that the country’s output comes a bit cheaper this year at U.S. ports-of-entry.
That’s also the case with two of the other three countries with double-digit growth in volume and value in 2017: India and Portugal. Only Spain managed to have strong growth in shipping and stronger growth in value.

Source: U.S International Trade Commission, Stone Update analysis
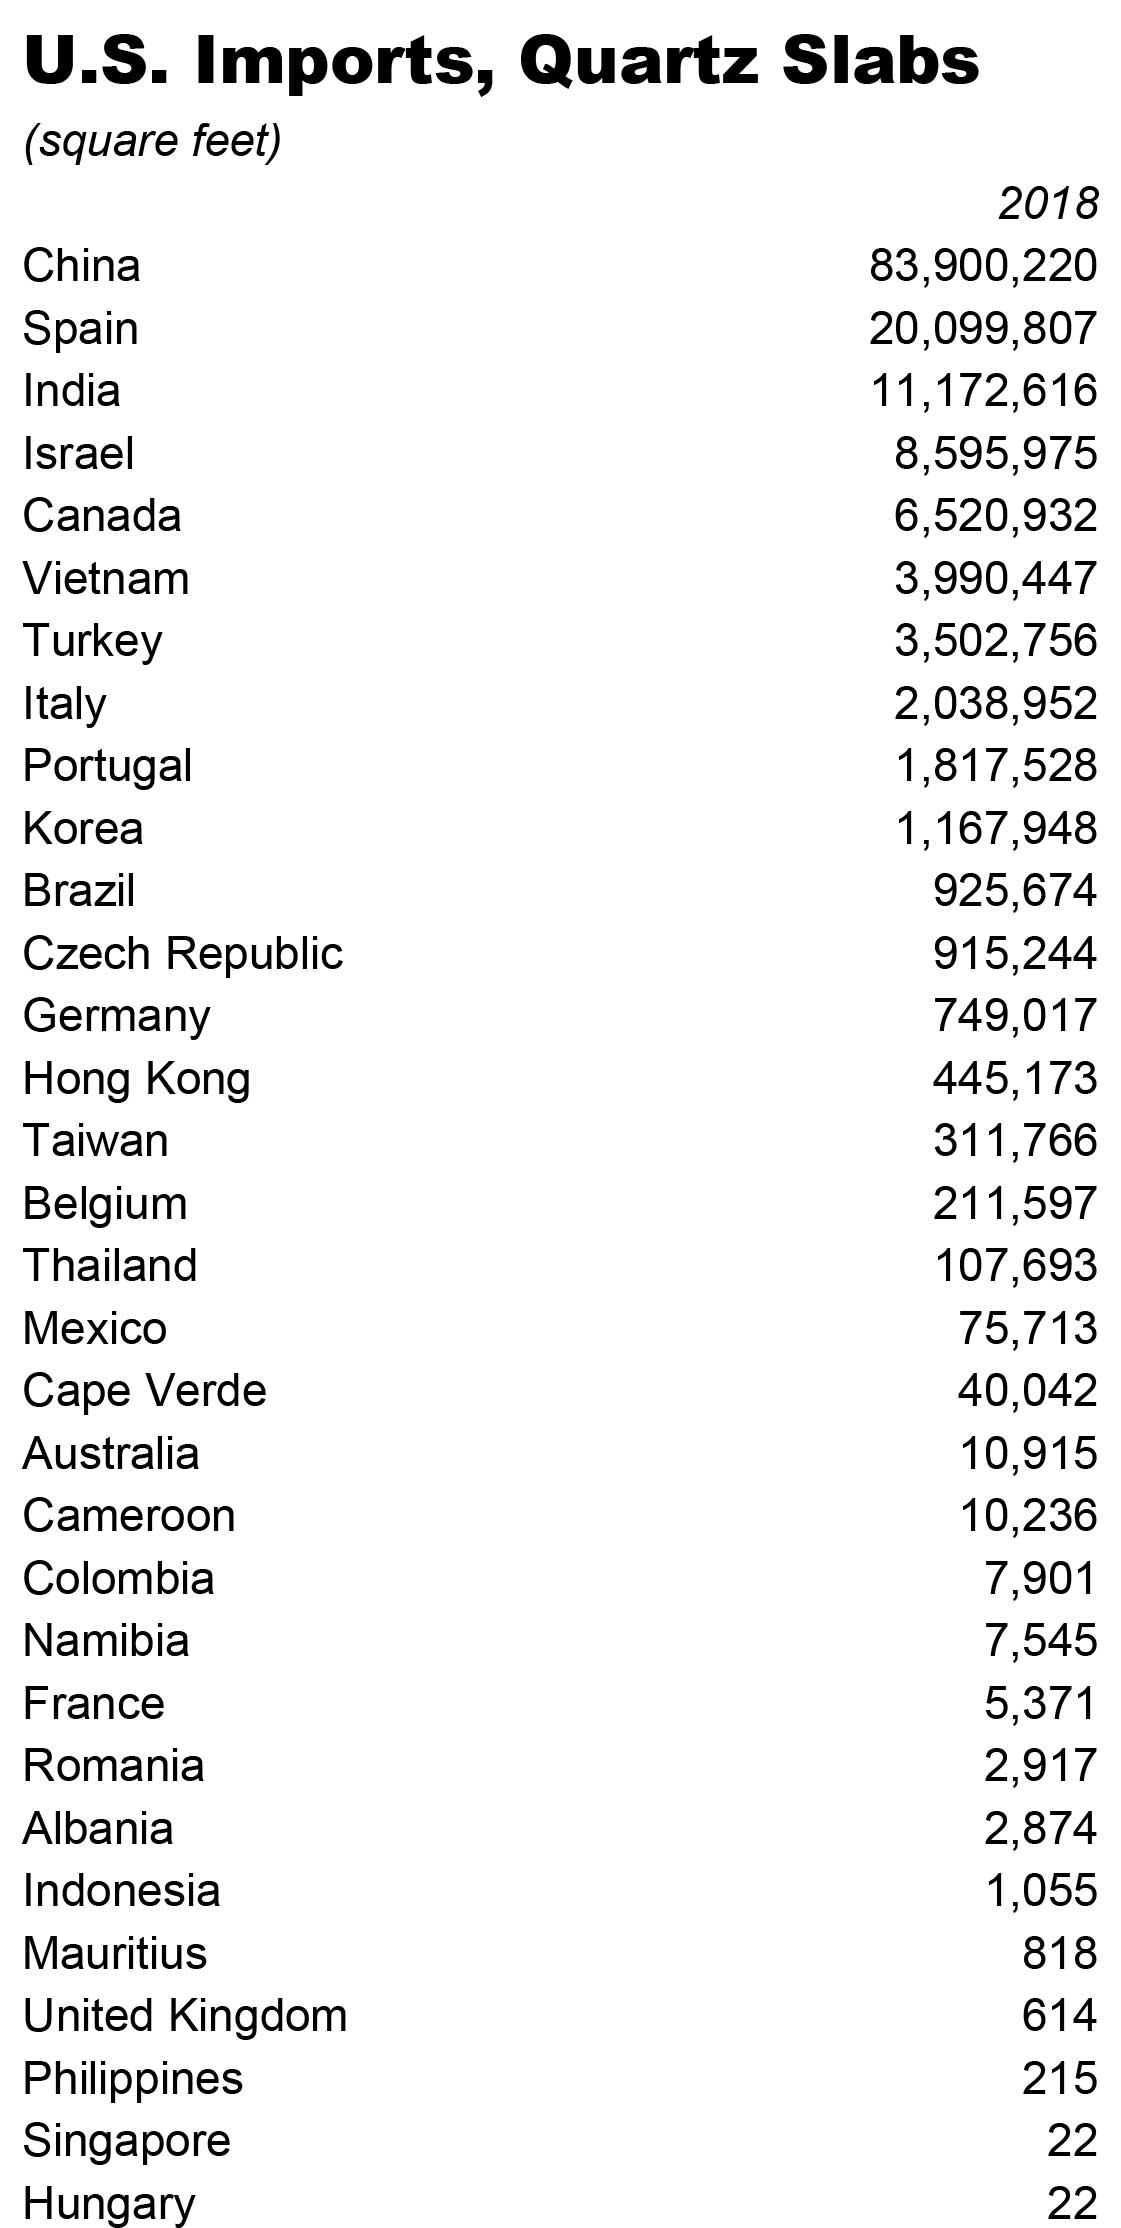
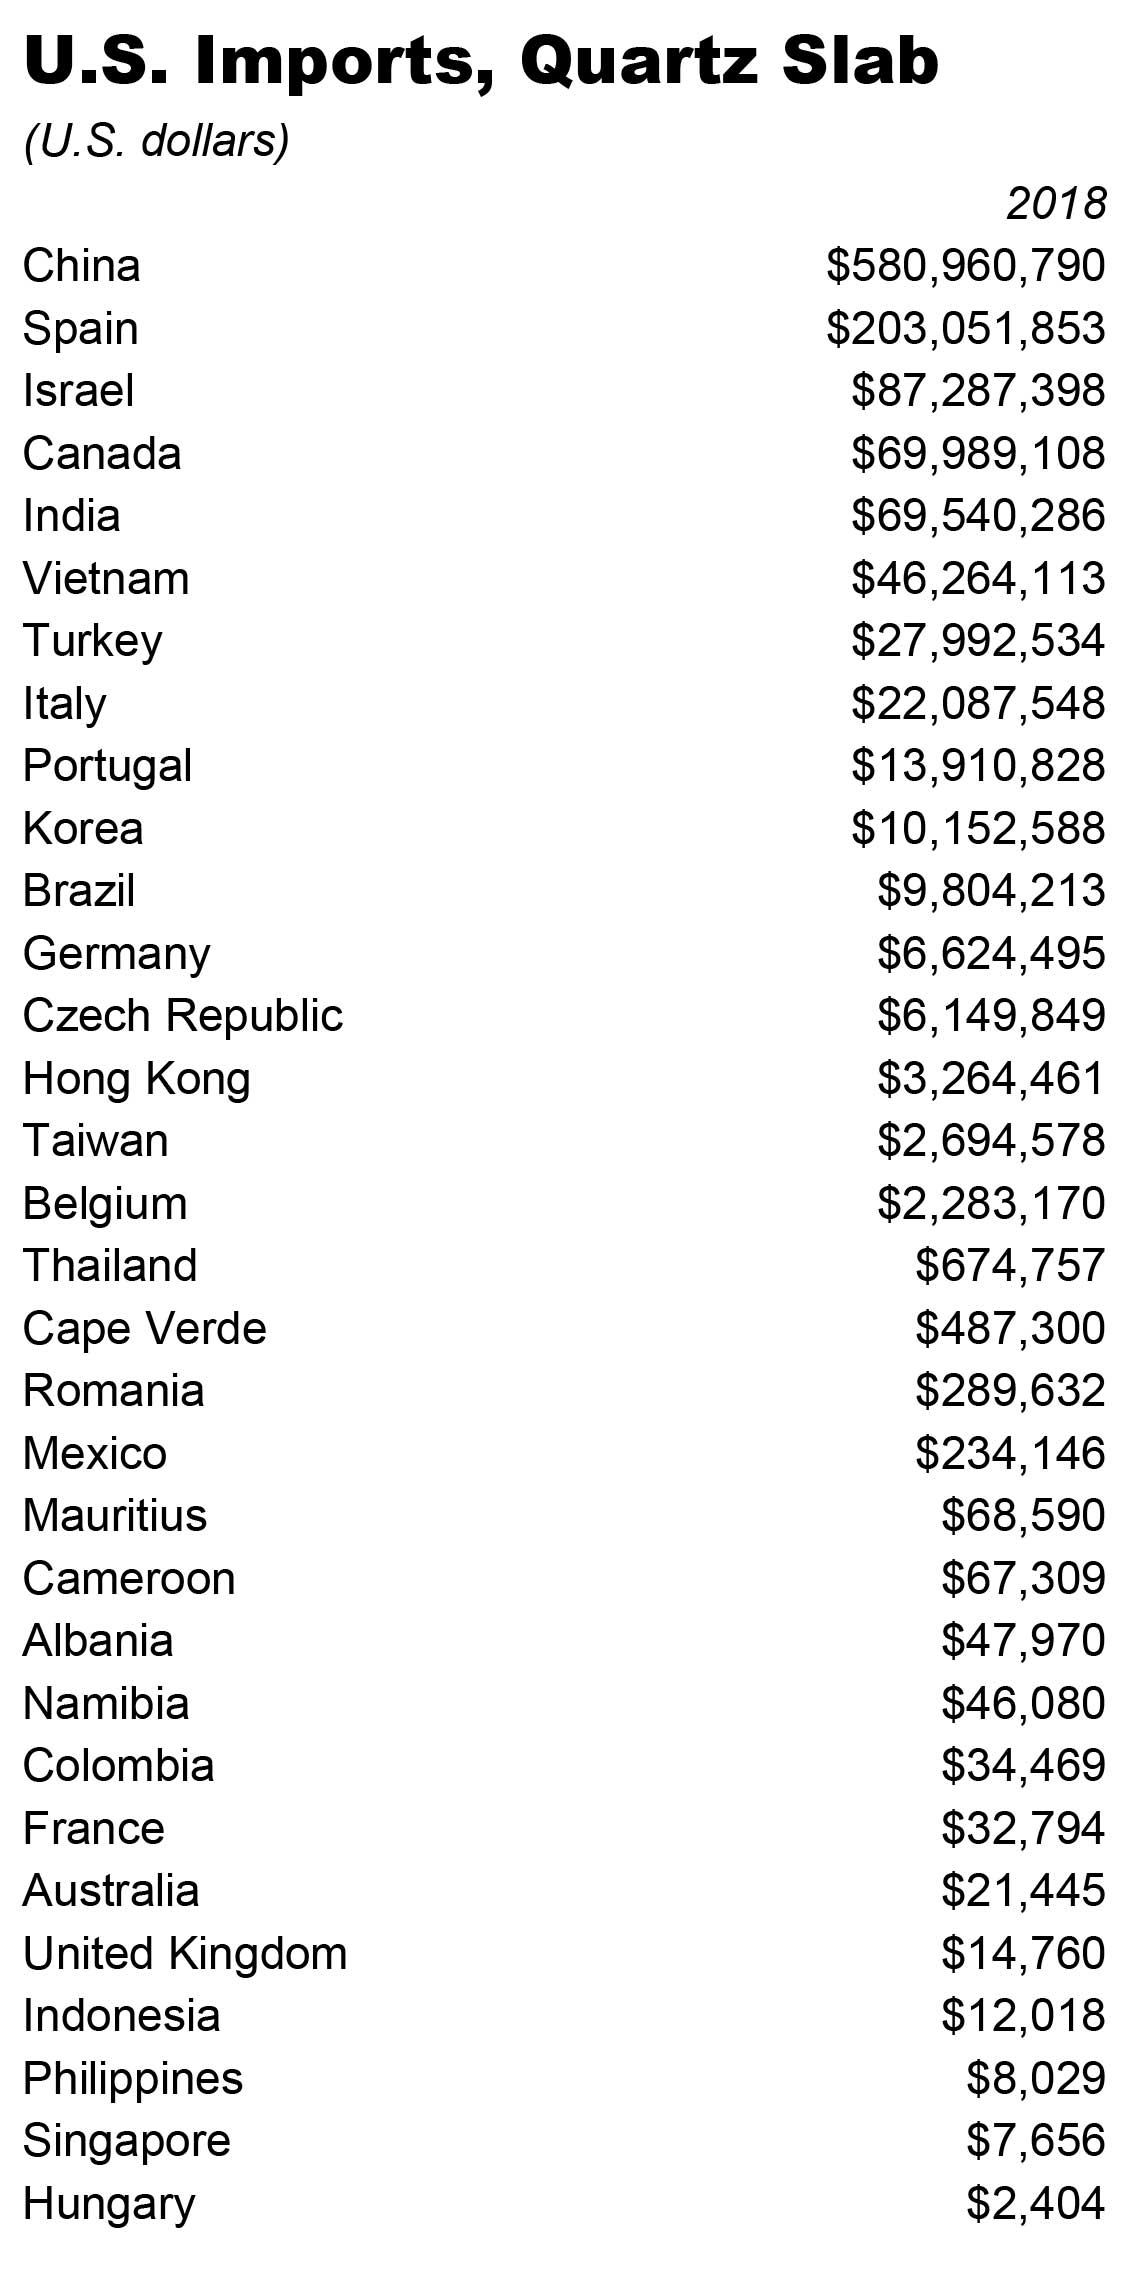
All Countries, 2018

Source: U.S International Trade Commission, Stone Update analysis

Source: U.S International Trade Commission, Stone Update analysis