Capsule
A review of U.S. and world conditions relating to the hard-surfaces industry.
Photo by Bill Oxford from Unsplash
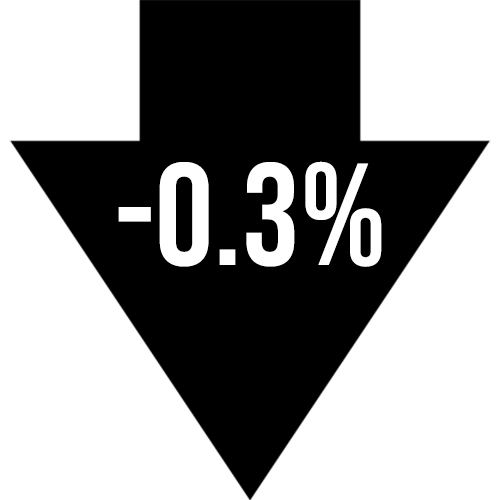
U.S. Hard-Surface Imports 2023 vs. 2022
(customs value)
January-March 2023: $1,051,206,742
January-March 2022: $1,235,847,208
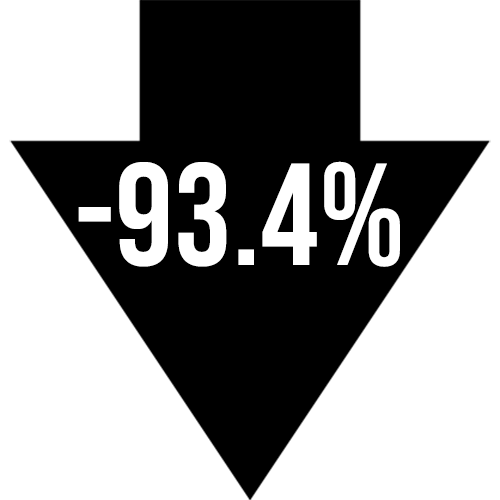
West to East / Pacific
Year-on-year pricing trends, China/East Asia to North America West Coast of 40' containers. ($15,255 / 29 April 2022, $1,000 / 7 April 2023). (Source: Freightos Ltd.)
Photo by Arun Yigan / Unsplash
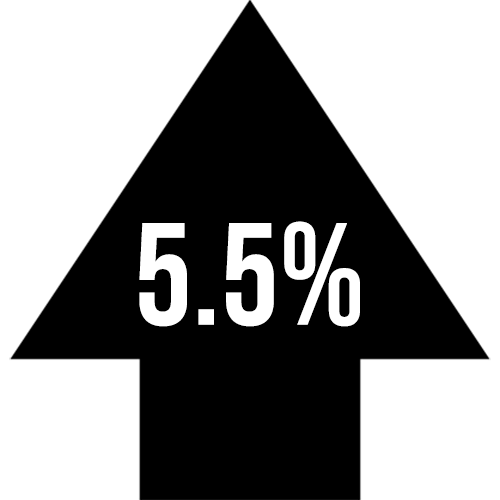
Inflation
Year-to-year rise of U.S. Consumer Price Index without food or energy costs, April 2023. (Source: Bureau of Labor Statistics)
U.S. Dollar vs. Euro
$1.00 = €0.935 (26 May 2022) to $1.00 = €0.932 (25 May 2023) Source: xe.com