First-Half 2020 Hard-Surface Imports
Charting a Different Course
From:

Photo by Roger Hoyles / Unsplash
Is 2020 a disaster for U.S. hard-surface imports? This year will go down in the books as one of the strangest for the industry. The first half of 2020 ended up as three months of good growth, followed by three months of masks. It’s tough to compare anything with previous years. We’re taking a different tack this year by swapping the usual graphs and tables with interactive maps to show the global trail of hard surfaces reaching U.S. ports-of-entries. All data comes from the U.S. International Trade Commission, with analysis by our sister e-magazine Hard-Surface Report. You can’t get on an airliner and go anywhere you please right now – so join in with some desk-chair globetrotting.

Pointing Out the Details
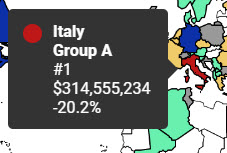
Our interactive maps require that you only move your mouse (or, with mobile devices, finger) over the country you want to check. You'll get a display showing:
Name Shipment-size Group Rank in the World January-June Customs Value Change from First-Half 2019
Need to magnify the view? There are +/- controls at the upper left of each map. The third "four-corners" button brings the map back to original size.
Total January-June 2020 Hard-Surface Imports: $1,646,883,886 (-15.2%)
Group A: More than $100 million Group B: $10 million to $100 million Group C: $1 million to $10 million Group D: $100,000 to $1 million Group E: Less than $100,000
Shipments include granite, marble, travertine, other calcareous, non-roofing slate and other stone dimensional surfaces, cut and polished on one side (worked); agglomerate slabs with quartz as the primer material; and porcelain ceramic flags and paving, hearth or wall tiles, of a water absorption coefficient by weight <= 0,5 % (excl. refractory, mosaic cubes and finishing ceramics)..